NASA Releases a Map Showing the World on Fire

When NASA aren’t capturing 200,000 stars in one image, or revealing Jupiter’s unseen beauty, they are busy creating a beautiful yet eerie aerosol map of Earth.
Aerosols are tiny and often invisible fragments of matter that are found in the air across the entire world. Although you may think you are breathing clear air, you are almost guaranteed to be inhaling incomprehensible amounts of particles.
Some examples of sources include windblown dust, sea salts, smoke from raging wildfires, volcanic ash, in addition to pollution from factories and automotive transport.
Whilst they may be invisible to us, NASA’s Earth Observatory has many ways to map the current aerosol quality of our atmosphere. As aerosols can have a negative impact on people’s health, it is key that NASA monitors their distribution and progress across the world, as well as being able to predict their movement.

The visualisation featured here is a form of a NASA model called the Goddard Earth Observing System Forward (GEOS FP), that they state “offers a similarly expansive view of the mishmash of particles that dance and swirl through the atmosphere.”
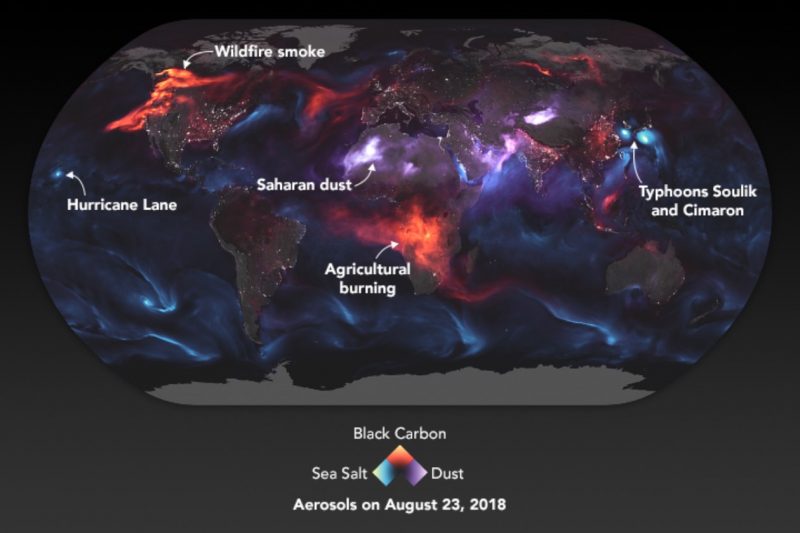
With black carbon particles represented as red, dust as purple, and sea salt as blue, the map is a burning and chaotic mix occasionally interspersed by flashes of electric blue. Painting a picture both beautiful and gloomy, the image seems more post-apocalyptic than scientific.

Formed from August 23, 2018, the visualisation shows smoke drifting from Canadian and North American wildfires, a roaring Hurricane Lane approaching Hawaii, and twin tropical cyclones bracing to thrash South Korea and Japan.
Despite these disasters, it seems most of the smoke emerging from central Africa is a consequence of farmers lighting agricultural fires, which occurs seasonally each year.

It is worth noting that the visualisation is not directly representative of satellite data; the GEOS FP uses mathematical equations to then calculate what the atmosphere may have contained on August 23rd. The model includes measurements of properties such as temperature, moisture, aerosols, and winds to simulate actual conditions.
For more visit NASA’s Earth Observatory website.